Balance on climate
I have no special expertise in climate science. I am an exploration geophysicist, not an atmosphere geophysicist, and am not qualified to assess climate models or predictions. Nor is it a part of science that I want to get into.
However, I am on LinkedIn and because I have a background in the exploration side of the petroleum industry many of the people in my network are also from that industry, and some are very sceptical about the reality of anthropogenic global warming (AGW). Scepticism is great, and vitally important, but one or two of these sceptics are taking up an irritatingly disproportionate part of my incoming posts. They are especially irritating when they are misinterpreting and insulting good working scientists. It is hard to respect the sort of person who thinks it adds force to an argument to use silly spellings, as in this example:
“ The government welfare funded klimut siyentists suicided their hypothesis with THEIR OWN NUMBERS. They imply (but conceal using complex circumlocution) creation of energy, and imply also that heat is a process of transient energy flow from cold to hot, violating each of the 1st and 2nd laws of thermodynamics”.
At this point anyone who claims to be a scientist needs to stand up and defend science. One of the diagrams this man used is shown below. “Plant food”, incidentally, is his preferred name for CO2.
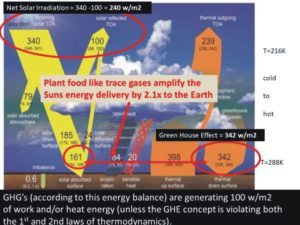
One problem with discussing this is that the underlying diagram is moderately complex, and the overprint muddies the waters so much that it is really quite hard to see what is going on. However, something very close to the original is not hard to find, it is a basic introductory tool to climate science and there are many versions on the internet. One of these appeared in a 2013 paper entitled ‘The global energy balance from a surface perspective’, with Martin Wild of ETH Zurich as the lead author. He and his co-authors obviously thought that it was clear and self-explanatory, and I am sure that it is, to a climate scientist. The rest of us have to work a little bit harder, and I found it useful to prepare a similar diagram with my own annotations and without any numbers. Hopefully, their absence can concentrate the mind on what it is that diagram was designed to show.
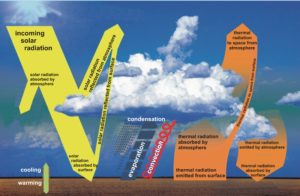
The fate of a solar photon
Consider a single photon arriving from the sun (this would be one tiny part of the Incoming Solar Radiation, represented by the yellow band in the top left-hand corner). There are four possible things that can happen to it. It can be directly reflected back into space from the atmosphere (principally from the cloud cover), it can penetrate the atmosphere and return into space after reflection from the Earth’s surface (snow cover being particularly effective), it can be absorbed by the atmosphere, on either its downward or upward journey, or it can be absorbed at the Earth’s surface. These four possibilities are illustrated by the yellow arrows on the left.
The energy carried by a photon absorbed by the atmosphere is transferred to the atmosphere. The atmosphere is warmed up very slightly – but it is, of course already ‘warm’- by which I mean merely that it has a temperature above 0°K. Similarly, the energy carried by a photon absorbed at the Earth’s surface very slightly increases the temperature of the Earth, which is also already warm. Being warm, these two bodies will have already been radiating energy before the photon arrived, the amount per unit surface area being proportional to the fourth power of the absolute temperature (Stefan-Boltzmann Law) and, because neither is an ideal ‘black body’, to a quantity known as the emissivity.
Earth temperatures – a digression
It is, of course, a massive over-simplification to treat either the Earth or the atmosphere as a single body, but these diagrams are starting points for discussions about climate, not end points. To simplify such discussions, the number of bodies being discussed has been drastically reduced, allowing the overall flow of energy to be divided into a number of easily identifiable components. Assigning a numerical value to each flow is a second stage, and they will. of course, be gross averages over both time and space. There is no point in worrying about whether or not they are even approximately correct until it has been clearly understood what it is that they are representing.
The flows that give rise to the most confusion are those internal to the Earth-atmosphere system regarded as a whole. The temperature distribution within this system is the product of a very long thermal history that has produced something very close to an energy equilibrium between an output of mainly infra-red radiation and a solar input of mainly visible radiation. The question “How close?” takes us into the arguments about global warming and global cooling that are emphatically not what this review is about. I am only trying to explain a diagram that seems to have been widely misunderstood.
Energy loss from a warm Earth
Being warm (i.e. having a temperature above absolute zero), the Earth will radiate energy from its surface. It also loses heat to the atmosphere by conduction, by convection and by evaporation of water from the surface and the delivery of its latent heat to the atmosphere when it condenses. All but the first (but largest) of these losses are dependent on the temperature distribution in the atmosphere. At the other end of the scale, the thermal conductivity of air is so low that the conductivity loss can be almost ignored, and it is not shown on the diagram. It has been said that it takes away from the Earth’s surface about as much energy as is delivered to it by conduction from the Earth’s interior, i.e. about 0.07 w/m2. The other two, mass transport, mechanisms, are significant but, on all such diagrams, together transfer only about a quarter of the energy transferred by radiation.
Some of this upward-directed radiation will penetrate the atmosphere and be lost directly to space, but the atmosphere is not perfectly transparent at these wavelengths, so some will be absorbed by it. This energy will appear as heat, and is the origin of the greenhouse effect. Acceptance of the idea that, when electromagnetic radiation passes through a medium, some of its energy will be absorbed by that medium implies acceptance of the existence of a greenhouse effect. The influence of each of the various components of the atmosphere on its magnitude is obviously contentious, but not the reality of the basic process.
Energy loss from a warm atmosphere
Being warm (i.e. having a temperature above absolute zero), the atmosphere will radiate energy. Some of that energy will radiate upwards, and be lost into space. Some will radiate downwards and will either be reflected from the surface or be absorbed by it. The reflected radiation, having only a slightly different spectral content from the radiation originating at the surface, is not usually differentiated from it but is included in the totals for radiation from the surface.
The downward directed radiation is the most widely misunderstood part of the whole diagram, and the most controversial. On the overprints the claim is made that it violates the second law of thermodynamics by implying transfer of energy from a cooler body (the atmosphere) to a warmer body (the Earth). This, however, is to misunderstand the second law, which is concerned with net rather than gross energy transfers. The Earth is receiving less radiant energy from the atmosphere than it is sending to it. There is no violation of any law of physics. It would be a violation of a law of physics (the Stefan-Bolzmann Law) if there were no such radiation, because no part of the atmosphere is at 0°K.
Conservation of energy
The overprint also claims that the underlying diagram violates the First Law of Thermodynamics, which states conservation of energy. It is a claim based on the numbers assigned to the various flows, which vary slightly between different versions but which always show the flow of radiant energy from the atmosphere to the surface as greater than the entire solar input into the Earth and the atmosphere. However, there is nothing in the laws of conservation of energy that forbids flows WITHIN a system that are larger than the external inputs and outputs into and out of the system.
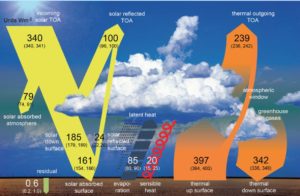
The final diagram is the one published by Wild et al. Numbers in the larger fonts are estimated average values of energy flows, numbers in brackets and smaller fonts are estimated error limits. This is not the place to argue about whether these numbers are right or wrong. Here the question being considered is ‘do they violate the laws of physics? Do they, to take the claim made on the overprints, imply that greenhouse gases are actually generating energy?
The simplest part of the system is the top of the atmosphere. The numbers show an inward flow of 340 w/m2 and outward flows of 100 plus 239, i.e. 339 w/m2. So 1 w/m2 is being retained within the system – the numbers do show some global warming although, it should be noted, the estimated retention is smaller than the estimated range of possible error.
What about the ground surface? It is receiving 342 w/m2 from the atmosphere and 161 w/m2 from solar radiation (total 503 w/m2), and losing 397 w/m2 by radiation and 85 + 20 w/m2 by mass transport (total 502 w/m2). This implies that the 1 w/m2 retention is occurring at the ground surface, and there is an additional 0.6 w/m2 shown on the far left that represents this. This is the only number not an integer, and when rounded up to in integer it is 1 w/m2. Wild et al might have been wiser to either do this rounding up, or show all other values to one decimal place, but they were probably not anticipating their diagram being used by people determined to misunderstand it.
What of the most complicated part of the system – the atmosphere? It is shown as absorbing 79 w/m2 from the sun, 85 + 20 w/m2 by mass transport and 397 w/m2 from the ground (total 581 w/m2), and radiating 342 w/m2 downwards and 239 w/m2 upwards and out into space. This also totals 581 w/m2, so there is an energy balance. The atmosphere is neither acquiring heat nor losing heat. Just enough solar energy and mass-transport energy is being supplied to counteract the net radiation loss. This might seem miraculous at first sight but is actually merely a consequence of the Stefan-Boltzmann Law. Were the solar input to increase, the equilibrium would be disturbed, the Earth-atmosphere system would heat up and would, as a consequence, emit more radiation. A new, warmer, equilibrium would be established. The opposite would happen if the solar input decreased. The fact that the radiation is proportional to the fourth power of the absolute temperature implies high sensitivity to small temperature changes.
Conclusion.
There is nothing that violates the laws of physics in the internal radiation flows within the Earth-atmosphere system, due to their existing temperature structure, being greater than the net input of energy in the form of solar radiation. It may be counter-intuitive, but intuition is not science.
It takes a very special sort of arrogance to suppose that all climate scientists who accept Anthropogenic Global Warming as a reality are not only venal, self-serving and corrupt but also so mind-bogglingly stupid that they will repeatedly issue diagrams containing errors of the magnitude suggested by the overprints. The sort of arrogance, perhaps, that believes an argument is enhanced by spelling climate as ‘klimut’ and science as ‘siyenz’.