Although it took a few years for its significance to be realised, there can be little doubt that the discovery, by Ron Mason and Arthur Raff, of linear magnetic anomalies in the Pacific Ocean west of California was one of the key factors in the development of Plate Tectonics. Things might have been very different if their work, arguably the first systematic magnetic survey of a large area of oceanic crust, had instead been carried out over the seas east of Queensland. Magnetic surveys in the central and eastern parts of this area have been fragmentary, and the EMAG2 compilation not only lacks resolution (Fig. 1) but is littered with ‘no-data’ areas, but it is doubtful whether even a systematic and detailed msgnetic survey would answer any of the geological questions in which the area abounds.
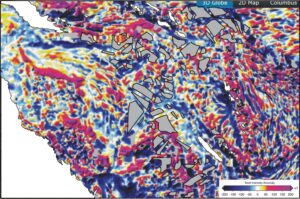
Visualisation of the EMAG2 grid for Duroca. Screenshot of map available on the GPlates portal. Grey shading defines major areas in which magnetic data are absent, and in many of these conventional bathymetric soundings are also sparse or non-existent. Land areas have been enhanced in white to facilitate positional appraisal. The map reveals a degree of complexity, coupled with a lack of linearity, that would be beyond the resolving power of the 2-arc-minute EMAG-2 grids, even without the data gaps.
What is the alternative? The region contains a complex of deep basins, shallow plateaus, seamounts and troughs, consisting in the west of three major and relatively simple units. From north to south these are the Coral Sea Basin, a well-preserved small ocean with a clearly defined spreading fabric, the Queensland Plateau, a large section of the Queensland shelf that, finding itself unsupported on its northeastern side by the opening of the Coral Sea, slid laterally, but not very far, into the newly created accommodation space, and the Marion Plateau, which is still firmly attached to the Australian continent.
Further east things get very messy indeed, and even the eastern boundary, at the Vanuatu arc and trench, is a great deal more complicated than might appear at first sight. To even begin coping with such a region requires uniform regional data sets, and one such is available in the form of the satellite-derived free-air gravity grids obtained by Dave Sandwell and his colleagues at the Scripps Institution of Oceanography (Figure 2b). In such an area, of course, it is also necessary to be guided by bathymetry, but the bathymetric grids, both those provided by the team from Scripps (Fig. 2a) and those published by GEBCO, rely on free-air gravity to calculate bathymetry in the gaps left by shipborne data. This fact renders the third possible step, of deriving Bouguer gravity by combining free-air gravity with bathymetry, a questionable one, but the map (Fig 2c) has its uses as long as its limitations are recognised.
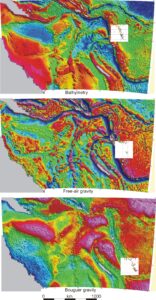
Figure 2. Maps of (a) bathymetry, (b) free-air gravity and (c) Bouguer gravity based on 1 arc-minute grids derived from sea-surface elevation data obtained using satellite-mounted radar. Earthquake hypocentre swathes are 0.5⁰ of latitude wide and are at same scale as the maps, without vertical exaggeration.
Marine free-air gravity is to a considerable extent determined by sea-floor topography, and it is therefore reasonable to ask whether there is anything to be gained by considering it, in addition to simple bathymetry. Figure 2b suggest that there is. In areas where water depth is changing rapidly the map is dominated by anomalies at wavelengths below those at which isostatic effects become significant, while in the plateau areas it is telling us something about the rocks of which those plateaus are composed. In a very utilitarian way, the free-air map can also be used to quality-control the bathymetry. In Figure 2a there is a narrow, but very noticeable, feature running southeast from the intersection point of the Pocklington Trough and the South Solomons Trench to the Vanuatu Trench south of Malekula. This feature is absent from Figure 2b. It is a ship track.
The most intriguing features in all the Figure 2 maps are the parallel arcuate troughs that extend respectively from the northern tip of the New Caledonia platform via the D’Entrecasteaux Fracture Zone to Espiritu Santo island in Vanuatu, and from the northern end of the Lord Howe volcanic chain to the junction of the South Solomon and Vanuatu trenches. The existence of these two features suggests that the sectors of the Vanuatu Arc north and south of Espiritu Santo should be very different. There is certainly far less current volcanic activity in the south than the north, and the global catalogue maintained by the National Earthquake Information Centre does reveal a dramatic change in seismicity in the vicinity of Espiritu Santo and Malekula, but it also shows (Figure 2) that the Wadati-Benioff zones to north and south have similar levels of activity, dip at only slightly different angles and extend to similar maximum depths.
I would not have expected that.
_______________________________________________________________________________
** Duroca? These days, the first thing to be done when dealing with any area that is largely covered by water, particularly if it is marginal to Australia, is to assign it a catchy name. In the recent marine geological literature, Zealandia has been followed by Argoland, but the area of sea that lies to the east of Queensland, to the west of the Vanuatu Arc, to the south of Papua and the Woodlark Basin and to the north of ‘Zealandia’ has so far been neglected. I toyed with the name Loopland, after Loop Islet in its approximate centre, but since the area contains almost no land that seemed scarcely appropriate. In the end I decided that I would call it Duroca, to commemorae the Duroc, a French packet-boat which, in 1856, managed the considerable feat of finding the one small area of shallow water in an extensive region of deep water on which to get shipwrecked. The wreckage came in handy when, a few years later, the crew of HMS Herald decided to erect a beacon on what is now known as Herald Beacon Island.