Since plate tectonics arrived on the geological scene there have been two significant advances in technology that have added considerably to the armoury of the people engaged in geological reconstructions. The first of these was the development of publicly available GPS positioning to the point that allowed relative plate movements to be monitored over periods of just a few years. The second was the improvement in seismic tomography that is allowing subducted slabs to be identified in the mantle even when they are no longer seismogenic.
Inevitably, neither of these methods is without its problems. The movements recorded by GPS provide a snapshot that may not be representative of the gross plate movements on geological time scales, and the results presented by tomography are based on sophisticated manipulation of data sets that have inbuilt deficiencies. Unless seismic wave travel paths are evenly distributed throughout the volume in question, which is very unlikely to happen, there will be some element of bias in the models produced.
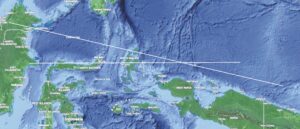
Figure 1. Seismic tomography cross-sections in the Indo-Pacific gateway region. The E-W cross-section has been presented by Wu et al. (2016) the WNW-ESE section by Hall & Spakman (2002). The Mollucca Sea is bounded to the west by the Sangihe Arc and to the east by the Halmahera Arc.
With tomography there is a further problem. Very few of those who wish to make use of the models as aids to reconstructing past plate movements understand what has been done to produce them, except in the most general terms, and the computer programs used have been developed by a relatively small number of practitioners. Do these people produce similar results when they apply their methods to the same areas ? Without direct personal contact, opportunities for direct comparisons are rare, but there is at least one in the literature, in an area that presents some rather special challenges. At least two tomographic cross sections have been published for lines crossing the Molucca Sea arc-arc collision zone, each of which is oriented roughly at right angles to the subduction zones on either side (Figure 1).
In Figure 2, which shows the WNW-ESE cross-section, the blue regions marked A4 and A6 are high-velocity anomalies that are discussed under those headings in the text of the original paper. They are typical of the aseismic high-velocity zones occupying considerable volumes that have been defined in the upper asthenosphere in tectonically active regions. In contrast to the zones associated with seismogenic slabs (such as those beneath the Halmahera and Sangihe arcs in the present example), the boundaries of the aseismic zones are diffuse, suggesting partial assimilation into the surrounding more fluid asthenosphere and also, very probably, reduced resolution with depth; the authors of the paper interpret anomaly A6 as identifying the present location of oceanic lithosphere subducted to the north between 45 and 25 Ma and now forming a flat-lying layer at the base of the upper asthenosphere, and as unrelated to the aseismic extension of the Halmahera subduction zone that creates anomaly A4. The A6 anomaly emphasises another problem with many tomographic ‘slab’ anomalies; even if these do represent subducted slabs, it is no longer possible to be certain of the subduction polarity.
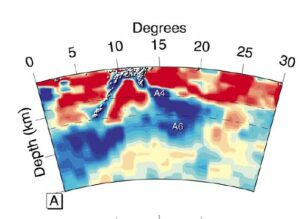
Figure 2. Tomographic section across the Molucca Sea arc-arc collision zone (Figure 4a of Hall, R. & Spakman, W., 2002, “Subducted slabs beneath the eastern Indonesia-Tonga region: insights from tomography”. Earth & Planetary Science Letters, 201, 321–336). No vertical exaggeration. Depth ticks are at 500 km intervals. Upper-surface ticks are at 5 degree intervals along a great circle path, oriented E 12 degrees S. White circles mark the hypocentres of earthquakes occurring within 50 km of the plane of section. The tomography is due to Wim Spakman, one of the pioneers of this form of subsurface investigation, and the section is derived from the global tomographic model of Bijwaard and Spakman (2000). The caption includes the comment that ” It should be noted that anomaly amplitudes vary with depth from many percent in the top of the mantle to typical peak values around 0.5% at 1000 km or deeper. All sections are contoured between –1% and +1% and relatively strong colours in the uppermost mantle or weak colours in the lower mantle should not be interpreted as an indication of significance or insignificance of imaged structure”.
Figure 3 shows both sections, geographically located and oriented. There are very clear similarities between the two, in the deep as well as the shallow parts of the section, but also some significant differences. In order to clarify these, the outline of the Wu et al. deep high-velocity zone, drawn at the darker blue-light blue transition, has been superimposed in yellow on the Spakman cross-section. Although both groups of authors use similar display parameters, the transfer cannot be exact because of the use of differene projections, but this cannot account for all of the differences. Most notably, in the more recent, Wu, cross-section there are discontinuities in the high-velocity anomalies associated with the currently active subduction zones at the lower ends of their seismogenic parts.
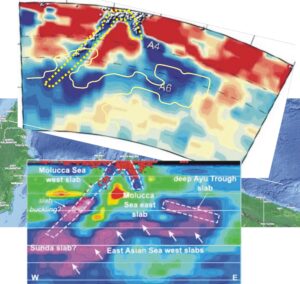
Figure 3. Tomographic section across the Molucca Sea arc-arc collision. The lower cross-section extracted from Figure 21e of Wu, J., Suppe, J., Lu, R. & Kanda, R., (2016). “Philippine Sea and East Asian plate tectonics since 52 Ma constrained by new subducted slab reconstruction methods”. Journal of Geophysical Research, Solid Earth, 121, 4670–4741, doi:10.1002/2016JB012923. Both groups contour their models in terms of percentage velocity anomaly, from +1% to -1%. Red colours indicate negative velocity anomalies (slow velocities), the colour