It is almost a defining feature of LinkedIn that in any day’s worth of posts there will be people claiming that just because their opinions conflict with the those of the majority, that does not mean they are wrong. No quarrel with that, I have some such opinions myself (aquatic apes, anybody?). The problem comes when such people reverse the argument and claim that this somehow proves they are right. When, in doing so, they wander into areas about which I think I know something, I have to protest. And increasingly I see that happening when gravity is being used to investigate geology.
As in Figure 1, a post based on a 1980 vintage, 1154 point, gravity survey at the northern end of Lake Gairdner in South Australia. The projection is UTM and the spatial coordinates are metres, so the survey rectangle is about 15 km N-S and 19 km E-W. I have no idea why the scales are different in the two directions, and I never got round to asking.
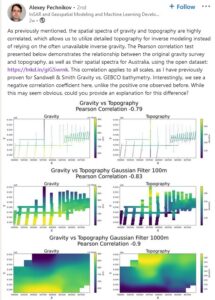
Figure 1. The original post
When I first saw this, I commented that no-one should present an image labelled simply ‘gravity’, since gravity data come in many different forms (absolute, free-air, Bouguer, fully terrain-corrected, isostatic etc, according to the processing that has been applied). I wrote
Alexey
In this post you are committing a very major sin.
You are talking about ‘gravity’ without specifying which sort, i.e. how the raw observed gravity readings were processed,
Without knowing that, we do not know whether to expect a negative or positive correlation with topography, or none at all.
I might also have added that no-one should present images of this sort without specifying the units, but after making that comment I looked more closely and noted (top right-hand corner of left-hand images) a ‘+9.783e6’, identifying the data presented unambiguously as absolute gravity in micrometres per second per second, often written g.u.. Which left another puzzle – why was it thought worthwhile to even ask the question. Anybody who has ever worked seriously with terrestrial gravity expects absolute values to decrease with station height, because the higher the station the further it is away from the Earth’s centre of mass.
The answer came back
Here is the exact description link attached! Do you mean you cannot follow the link or you cannot understand the description? And of course, the correlation sign is the exact answer.
This didn’t seem to take me much further, especially as there was no link attached, so I tried again
What I mean, Alexey, is that no one should be presenting gravity data without specifying the processing done. Referring readers back to some other document is not adequate
This clearly upset him
In this way, you don’t need to write anything because that’s meaningless for unlettered persons 🙂 I suppose you will ask me soon to add programming tutorial and spectral analysis theory and practice and so on as plain text into each my LinkedIn post. Really? In case you can read, the link is enough and you can perform the spectral analysis and get the results on your side in case you don’t believe my ones. And I always recommend repeating all the results from any paper and any source because reproducibility is low even for well-known and per-reviewed sources.
Well, since the data were available, I thought I might have a look. And since correlation was the what the original post was all about, I did not need spectral analysis. Excel scatter plots were good enough.
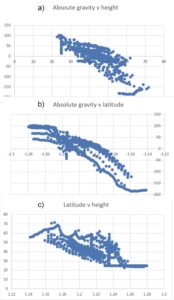
Figure 2. Correlation plots for Lake Grainger gravity data. Gravity values in g.u. minus 9,800,000. Height values in metres minus 120. Latitude values in degrees south minus 30.
The correlation of absolute gravity with height is, of course, there but there are a lot of other things going on, and the regression line for the first plot did not have the slope of about 2 g.u. or 0.2 mGal to the metre that would be expected if reading point height were the only thing affecting gravity. The second plot shows one very good reason; gravity, as we all know or should know, is also correlated with latitude, and the third plot shows that In this area, in which the edge of Lake Gairdner trends almost precisely E-W, the topography rises from south to north, so both station elevation and station latitude contribute to the reduction in gravity. Mildly interesting, but no real help if one wants to understand the geology. To do that, one needs to look at the Bouguer gravity or one of its more refined variations. I did that, but I also wrote back to Alexey, matching his obvious irritation.
Anyone who processes data needs to understand that data. The more sophisticated the processing, the more important the understanding.
I am increasingly aware that you do not understand gravity.
In your recent post re gravity data from Australia you show correlation with topography and express surprise that it is the opposite of that for marine data. You do not recognise that just describing data as ‘gravity’ is not enough.
When dealing with terrestrial gravity data, we correct
1. for Earth ellipticity (Latitude correction, ~7 g.u/km at this latitude).
(1 g.u.= 1 micrometre/sec squared)
2. For distance of the observation points from Earth centre (Free-air correction, ~3 g.u./m)
3. For gravity effects of topography. Bouguer correction or other corrections taking more account of the real shape of the terrain.
Only after making all three can we hope to see geological effects.
The gravity you use here had none of these corrections and in it going north reduces gravity for reasons 1 and 2. You ignored the obvious correlation between gravity and latitude. The N-S extent is ~15 km, so 105 g.u, change and the height range is ~45m, so 135 g.u, change,
If you do not understand this you should not be writing about gravity.
To which he replied
You just cannot see the forest for the trees; let’s think about measured gravity on Earth’s surface produced by real masses. Just use Newton’s law to find gravity for any known density distribution and use inverse modeling to find the density distribution for the know gravity. Reductions were invented for manual gravimetric measurements processing and these are useless for numerical modeling. Do you understand the gravity of known Earth’s density distribution on top of known topography can be calculated exactly? Obviously, gravity depends of the distance to all the sources and so it depends of elevations but for you it’s like magic! By the way, the answer to the question is very easy because the correlation sign depends of the measurement position. See how Sandwell & Smith gravity is defined for a land area and that’s all.
The discussion trickled on for a couple more posts, but this is the crucial one, because Alexey has been claiming that his spectral analysis approach to gravity can be used to investigate geology with unprecedented resolution, and this shows how far he is from understanding what he is trying to do. Let’s break his answer down.
Just use Newton’s law to find gravity for any known density distribution and use inverse modeling to find the density distribution for the known gravity.
The first part of that sentence simply describes what pretty-well everybody involved in interpreting gravity in terms of geology routinely does; it is called forward modelling, because it starts with a density model and compares the field it produces with the field actually observed. The second part describes something that, unless constraints are applied, simply does not work, because there are multiple density distributions that can produce any given gravity field. Only if the model is constrained (e.g. a single interface at varying depth) is a unique solution possible by inversion. In all other circumstances it becomes the job of the human interpreter to decide which of the multiple possibilities is likely to be closest to the truth. A.I. may get there in the future, I guess, but it is nowhere near it yet.
Reductions were invented for manual gravimetric measurements processing and these are useless for numerical modeling.
Gravity reductions were developed because absolute gravity is a composite of the effects of latitude-dependent gross Earth effect, elevation effect, topographic effects and geological effects, and if it is the (usually comparatively weak) geological effects that we are interested in, it makes sense to remove those other effects, as far as possible. These days, with excellent topographic information, it is indeed very possible, and the results of doing so are eminently usable in numerical modelling. The effect of applying conventional reduction techniques to the data from Lake Gairdner is shown in Figure 3, together with the topography. This gives us something that we as explorationists, can work with, even to the extent of defining a drilling target. Something correlation plots are never going to do.
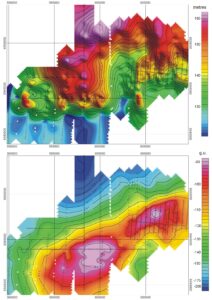
Figure 3. Above; Topography, from heights recorded for gravity stations. Below. Bouguer gravity
Alexey continued
Obviously, gravity depends of the distance to all the sources and so it depends of elevations but for you it’s like magic! By the way, the answer to the question is very easy because the correlation sign depends of the measurement position.
So it seems that Alexey did know the answer to the question he posed in his original post. Only he can know whether he knew it then, or arrived at it during the course of the conversation that followed. And no, it is not magic to me. In fact I have written a book about that subject, among others. Alexey, however, had one last chance to demonstrate what he knew.
See how Sandwell & Smith gravity is defined for a land area and that’s all.
Which, whatever it is intended to mean, revels one thing very clearly. Alexey really does not know very much about the origins of the data to which he applies his (no doubt very sophisticated) computer processing. If he did, he would know that Dave Sandwell and Walter Smith did not define gravity for land areas at all, because they were interested only in marine gravity. They filled in the land areas with information obtained from other people.