Every so often being on LinkedIn proves worthwhile. Had I not been, I would probably never have known that in 2020 Australia’s Northern Territory Geological Survey (NTGS) had published a full-colour magnetic map of their entire area, at 1:2,500,000 scale and, moreover, that if I wished, I could download a copy. It represents, so the caption goes, ‘a compilation of airborne magnetic surveys acquired by the NTGS, Geoscience Australia and the private sector since the mid-1960s’.
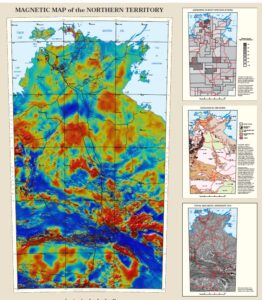
Figure 1.The Northern Territory magnetic map, 2020. Reduced to pole (RTP) magnetic anomalies
I wonder.
Geoscience Australia did not, of course, exist back in the mis-1960s. In those days we were the BMR, the Bureau of Mineral Resources, sometimes referred to by the inhabitants of the further-flung parts of the Territory, who regarded us as city slickers not fit to be out in the bush, as ‘those crats from the Bureau’. The BMR had been flying aeromagnetics and radiometrics across vast chunks of northern Australia well before the mid-1960s, with fluxgate magnetometers mounted in two air-force surplus DC-3s, VH-MIN and VH-RES. That was all a well-established routine long before I became the most junior member of a field party that was flying the Georgina Basin in 1963. Has all that early work now been superseded, or are there, hidden away in the mass of data compiled by the NTGS, some of the surveys on which Ces Leary imposed her ferociously high standards of data reduction and presentation from the early1950s onwards?
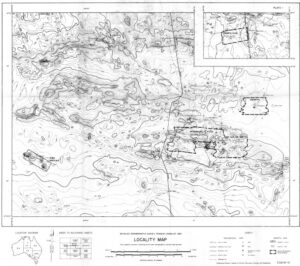
Figure 2. The ‘Aeromagnetic Ridge’ at Tennant Creek. Reproduced from BMR Record 1964/180. The areas covered by the VH-GEO survey are enclosed by dashed lines.
What really interested me, though, was whether the NTGS had used a slightly later survey. By mid-1964 I was in Tennant Creek as a party chief (promotion came fast in the BMR in those days), flying part of a feature that had come to be known as the ‘Aeromagnetic Ridge’, which was not a ridge in any topographic sense but a feature on the magnetic map. It had been found by surveys at the standard regional scale, had been better defined by later semi-regional surveys, and then we had been sent up to fly a part of it, at low level and with close spacing, using what was then an almost experimental system, with one of the new-fangled proton magnetometers designed and built in Australia by John Newman, with the sensor in a towed ‘bird’ dangling from VH-GEO, a single-engined, high wing Cessna 180. Flying height nominally 280 ft above ground so the bird would be at 250 ft, and line spacing a tenth of a mile (Australia had not yet gone decimal and metric).
The impetus behind this was the importance of Tennant Creek as a mining district, and the then-current paradigm was that the ore-bodies were most likely to be associated with ‘ironstone’ magnetic anomalies where these occurred at the intersections of magnetically-defined shears. The topograpy was far from extreme, but there were some quite steep-sided ridges to be got over, and the comparatively low-level made it exciting. Not quite as exciting, however, as the survey we had just completed down in western Tasmania, where one of the non-voluntary navigators (we took it in turns to do this, using maps or air photos to tell the pilot where to go) once wrote ‘This is suicidal. I do not go again’ on the flight log when he got back.
Wondering what had gone on since, I googled ‘aeromagnetics Tennant Creek’ and had what was for me a first (and probably never to be repeated) experience. I came out top! The first item on the list was my own 1964 survey report, complete with copies of the maps from the semi-detailed survey (Figure 2) and my own detailed survey (Figure 3).
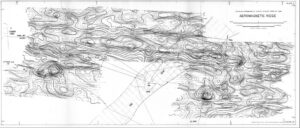
Figure 3.The aeromagnetic map produced from the VH-GEO survey in 1964. Reproduced from BMR Record 1964/180.
It was nice to be able to compare data at the three different scales, and it was nicer still to be able to take things a bit further and see if the latest grids, with their 80m cell-size (about half of our flight-line spacing), would allow a closer look at the regional magnetic setting. Generously, the NTGS have placed on-line not only the reduced-to-pole (RTP) grid used for the published map, but the underlying total magnetic intensity (TMI) grid and the grids of the first vertical derivative of each. There was just one snag. These are available only as single zip files of something a little north of three-quarters of a gigabyte size. At Welsh-border internet speeds it took about an hour and a half to download just the TMI, and it was only by great good fortune that Welsh-border internet reliability was, for once, equal to the challenge.
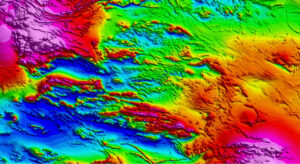
Figure 4. The ‘Aeromagnetic Ridge’ (left of and below map centre) and its magnetic surroundings. Map produced in Geosoft from TMI grid downloaded from the Northern Territory GEMIS (Geoscience Exploration and Mining Information System) website.
Access to the grids is important, because not only does the map only show just one of the parameters, but the resolution is inevitably not high enough to to justice to the 80m grid cells. Moreover, the conventional display used in Figure 4 is not necessarily the best way of showing the data. Sometimes other approaches are better, for some purposes.
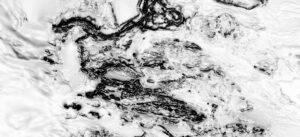
Figure 5. The same data (for a slightly different area), displayed in Global Mapper, emphasising the gradients of TMI.
And might those purposes not include some things beyond the strictly commercial? It is good fun to play with these grids, and could be fun for people who could use them to learn some things that might surprise them about their local areas. Could they not be available in forms usable by schools able to afford relatively cheap applications such as Surfer? That is not how they are available at present. The zip file that I downloaded contained just one .ers data file, with about 1 Gb of data coveringthe whole of the Territory. Even the subset I extracted for Figure 4 contains a million data points.
OK, I can handle that, but then I am in the business of doing so. Would it not be nice for the grids to be available to Northern Territory people with less specialised software, who might be able to make their own images on their own computers, using grids could be of smaller size? A model for this could be the equally enormous global gravity data set made available by Dave Sandwell and his colleagues at Scripps. To access any part of that, you just have to specify two latitudes and two longitudes. To have something like that available for the Northern Territory could do wonders for promoting geophysics.