According to NASA, the new Earth Gravity Model EGM2020 has been completed, although not yet released. Its predecessor, EGM2008, represented a step change in resolution from the earlier EG96, with a claimed 6-fold improvement in resolution. Produced by geodesists, to whom descriptions of the grids as providing coverage to degree and order 2159 presumably means something, for the rest of us to is easier to note that the results are provided on a 5 arc-minute equiangular grid, implying a data-point spacing of a little over nine kilometres. This was certainly better than the 15 arc-minutes of EGM96, and much better than the 30 arc-minutes of EGM84, the grand-daddy of them all, but it seems to be as far as NASA and its partners are prepared to go, because EGM2020 will have the same grid spacing and will be a superior product not because it will achieve higher resolution but because it will be based on improved and more comprehensive inputs. It will include data from the GOCE satellite, which was launched in 2009 and carried a gravity gradiometer, and the short wavelength components will be enhanced by new terrestrial data from places such as Antarctica, where measurements were almost totally lacking in 2008, and by more detailed coverage of other areas. In some areas it will make use of the results of airborne gravity and gravity gradiometer surveys, which were almost non-existent in the years when EGM2008 was being assembled.
All, however, is clearly not well. The completion of EGM2020 was announced in May 2020 in an abstract submitted to that year’s general assembly meeting of the European Geophysical Union, but now, almost three years later, the grids have yet to appear in the public domain. Moreover, a red-lettered footnote to the online version of the abstract informs readers that ‘This abstract will not be presented’.
What are we losing by not having EGM2020? The latest update findable on the internet is dated September 18, 2019, and it confirms that the structure will be the same as EGM2008, with a 5’ x 5’ grid based on an ellipsoid harmonic model to degree and order 2159, which will be released (if ever) as a spherical harmonic model to degree 2190 and order 2159. It will it differ from EGM2008 in using an improved altimetry model, improved reference field, improved satellite solution (incorporating GOCE) and correction coefficient set, but most important of all, it will make use of a great quantity of additional terrestrial (including airborne) data. The distribution of that data is shown in a map included in the update.
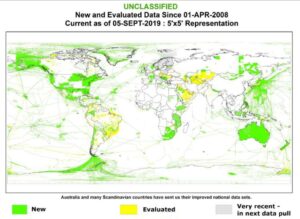
Figure 1. Overview of data that have become available for global gravity models since EGM2008, from Barnes, D., Beale, J., Ingalls, S., Small, H., Ganley, R., Minter, C., and Presicci, M. (2019) EGM2020: Updates. Note that this shows only data added, not the full coverage
We await EGM2020 with bated breath, but there have been other models released since EGM2008 that provide different information and/or greater resolution. The two most important have been WGM2012, prepared by the Bureau Gravimetrique International (BGI), and GGMplus, a collaborative venture between Curtin University in Perth, Western Australia and the Technische Universität München.
WGM12 is basically an extension of EGM2008, accepting its values, which are of free-air gravity, and using the enormous improvements in defining the topography of the Earth’s surface to calculate topographic and isostatic corrections, and so produce gravity maps corrected for both terrain and isostatic effects. The first of these maps is labelled by its authors as a map of spherical Bouguer anomalies, but these are very different from the Bouguer gravity anomalies as usually defined, which are based on corrections for topography approximated by a uniform flat plate, sometimes with further corrections for departures of the real topography from that model. The spherical Bouguer correction is based on a uniform shell surrounding the Earth, which has twice the effect of the flat plate. It is this that is corrected for global topography and the corrections calculated in this way end up being very similar to those calculated using the flat plate. The problem with this approach is that global topography is now defined in much more detail than is the global gravity field, and things go haywire if the maps produced are drawn at too large a scale. At continental scales, however, the results are impressive.
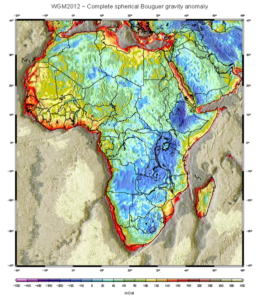
Figure 2. Complete spherical Bouguer gravity anomaly of Africa, from the website of the Bureau Gravimetrique International. There is an inverse correlation with crustal thickness.
GGMplus, on the other hand, represents a reversion to basic free-air anomalies but is an advance on EGM2008 in two different ways. Firstly, it adds in GOCE data, which is a mathematically impressive thing to do, and it also makes full use of available detailed topography to calculate free-air effects on a 7.2 arc-seconds (~200m) grid. The BGI summarised the model as encompassing gridded estimates of (i) gravity accelerations, (ii) gravity disturbances, (iii) quasigeoid undulations, and (iv) deflection of the vertical components, distributed in 5° x 5° tiles. They also emphasised that short-wavelength features less than about 10 km were computed with gravity forward modelling from 7.5 arc-second (~200 m) SRTM topography by assuming a constant density of 2670 kg m-3, and added that ‘These short-wavelength features are not amenable to standard ‘mass difference’ interpretations’.
And therein lies the rub.
Every so often one finds on the internet, and sometimes in journals and even in commercial reports, the erroneous assumption that detailed grids imply detailed information. Nowhere, perhaps, is this more true than in the use of gravity models in geology, and the global grids now available are particularly seductive. It was, in fact, an attempt to use the 200m grids of GGMplus to interpret the economic geology of West Sumbawa that I found in a post on LinkedIn that prompted me to look into the current status of global gravity models. So, to wind up this enquiry, let us take a look at West Sumbawa.
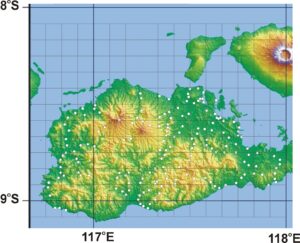
Figure 3.Gravity observation points on Sumbawa, from the Getech database
It has to be said that it is a pretty mountainous place, so free-air gravity will vary very rapidly from place to place. The people who prepared the GGMplus grids are geodesists, so it is those variations they are interested in. In the absence of actual measured gravity, they used gravity calculated from topography, using a standard density. Far from ideal, but it was all they had, and better than nothing.
As far as mineral exploration is concerned those calculated fields are completely useless. Because of the use of a standard density, they contain no information on the density variations that are the bread and butter of the explorationist, however useful they might be in better defining the geoid. The only information in GGMplus that might be of use in searching for minerals is the information, contained also in EGM2008, that was derived from terrestrial gravity measurements. For West Sumbawa those observations were almost certainly limited to those contained in the database of Getech, the Leeds University spin-off company that compiles not only public domain but company information (the latter under conditions of confidentiality) and which collaborated in the compilation of EGM2008. The locations of those observation points are shown in Figure 3, on which is superimposed a 5’ x 5’ grid. A significant number of the grid squares contain no observation points so values there would have had to be interpolated, and where there are multiple points in a square values would have had to be averaged. The data was thus incorporated into EGM2008 in a degraded form. The most that can possibly be extracted from the gravity data is, as always, whatever can be extracted from the raw data.