While putting the beach-balls on the illustration to last month’s blog, which was about the seismicity of the faults that first inspired Andrija Mohorovičić’s ground-breaking insights into Earth structure, I was alerted to a recent LinkedIn post by Felipe Ochoa-Cornejo that showed a new (to me) diagram that provided a guide to what these rather weird objects were showing. It is a modification of the Kaverina diagram that is used (by some people) to display the different tectonic regimes that are defined by different styles of faulting. On the original diagram the various zones were just coloured but, inevitably, someone (actually José Álvarez-Gómez) has since added beach-balls. Which is, I thought, fine for those people already familiar with such diagrams – but what about the rest of us?
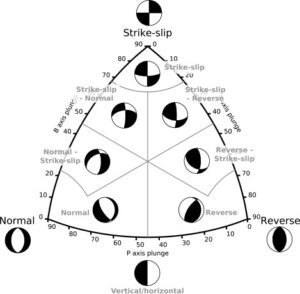
The Kaverina tectonic diagram, as modified to include the seismicity beach-balls.
The big problem with the diagram as it stands, is that although it is very good at defining the sorts of faults associated with different sorts of beach-ball, it doesn’t tell us anything much about the directions of movement. Perhaps a few additions might make all the difference?
A few arrows, to show directions of motion? To remind everyone (including myself) that with the conventional colouring scheme, the motion is always along the focal plane from a white quadrant to an adjacent black quadrant, and not the other way round. And also, as a reminder of the fact that it is the lower half of the beach-ball that is being displayed, and a as demonstration of how the boundaries of the quadrants are defined, a picture showing how energy is radiated from the earthquake focus?
And a reminder also of the ambiguity? A reminder that we can’t tell from the radiation pattern which is the focal plane, along which the movement takes place, and which is the auxiliary plane, along which nothing very interesting happens?
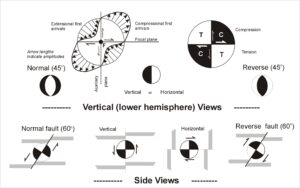
And finally, to get a feel for the three-dimensionality of the subject matter, what about looking at the beach-balls sideways on?
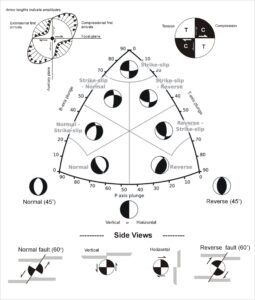
The modified and expanded Kaverina diagram, with the motions defined on a beach-ball for a pure strike-slip fault (top-right), and the outgoing radiation pattern that defines the quadrants shown top left. The bottom row shows side views of ‘beach-balls’ for faults with movement in the vertical plane only (pure normal or pure reverse).
That, certainly, is a more informative diagram, but is it perhaps just a wee bit over-complicated? Do all those pictures of the beach-balls for faults where the movement is neither 100% horizontal nor 100% vertical merely make it all much more difficult to understand the fundamentals? Is it not, in fact, enough just to remember that, for the conventional beach-balls viewed from above, if the centre part is white, then the vertical movement is normal, and if the centre part is black, the vertical movement is reverse?
Is not that all that you really need?