The story of the separation of Madagascar from Africa appears rather simple at first sight but, like almost everything geological, the more closely it is examined, the more complicated and less understandable it becomes. One of its complications is provided by the existence of the volcanic Comoros chain that extends two-thirds of the way from the extreme north of Madagascar to the coast of Mozambique.
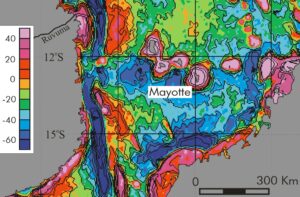
Map 1. Free-air gravity map of the Comoros Islands and the surrounding area. Values in mGal, from the Sandwell-Smith satellite-derived grids
A preliminary look at the chain’s volcanoes does suggest simplicity, since the islands appear to obey the rules of hot-spot volcanism, the active centres being at one end and the extinct remnants further east becoming progressively older the closer they are to the other end. This progression extends to the volcanic exposures on northern Madagascar, and when I was working on the geophysics of the area some years ago we were all reasonably happy with this summary, and also paid little attention to the easternmost island, Mayotte, since it was French and not part of the Union of the Comoros on which our attention was concentrated. Then, in May 2018, something very curious happened. As described in a recent article in Eos, the marine area immediately east of Mayotte quite suddenly became seismically active, and in November of that year a strange seismic ‘hum’ was recorded from the same bit of ocean. Local fishermen reported dead fish on the surface and a smell of burning rubber. It seemed that, right in the middle of the Comoros chain, magma was again on the move, and this was spectacularly confirmed when scientists on the research vessel Marion Dufresne identified an eight-hundred metre high volcanic pile on the sea floor. It had not, according the scientists of the Institut de Physique du Globe de Paris (IPGP), been there five months earlier.
For anyone interested in these events, a good place to start is the paper by Anne Lemoine and her colleagues entitled “The 2018–2019 seismo-volcanic crisis east of Mayotte, Comoros islands: seismicity and ground deformation markers of an exceptional submarine eruption”, but associated with this paper is a mystery that has nothing to do with geology. None of the authors (and there are ten of them) are mentioned in the Eos article, and none of them are from the IPGP. Most are from the BRGM’s Direction Risques et Prévention and, as befits people concerned with risks and their prevention, their focus is very much on the seismicity. Should not the geo-journalist who wrote the Eos article have mentioned their work also? Therein, surely, lies a tale about the vagaries of publication and publicity.
But, to take the geological story where I so often like to take such things, what about the gravity field?
One thing the Eos article did provide was a very nice bathymetric image, but to make direct comparisons between the bathymetry and any gravity maps that can be generated from public domain data it is logical to turn to the satellite-derived grids provided by Dave Sandwell and his colleagues at Scripps. Not only do these provide gravity data, but they also provide a bathymetry which, despite its relatively low ~ 5 km resolution, is a good starting point for any study. And, as Map 2a shows, there is nothing startling in the bathymetric patterns around Mayotte, although the linear bathymetric high with a roughly W40°N trend is intriguing. It links the northern edge of the Mayotte edifice to the northern edges of the edifices of the islands of Anjouan and Grande Comore.
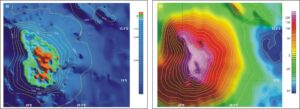
Map 2. a) Bathymetry in the vicinity of Mayotte, based on the satellite-derived 1-arc-minute grid. Contour interval 500 metres.b) Free-air gravity in the vicinity of Mayotte, based on the satellite-derived 1-arc-minute grid.Contour interval 10 mGal
Nor is there a great deal to be said about the map of free-air gravity (Map 2b), which is completely dominated by bathymetric effects. In order to obtain gravity-field images from which anything useful can be extracted, the only way forward is to apply the (highly suspect) marine Bouguer correction, and add to the ‘real’ gravity field the gravity field that would be produced by a layer of rock that entirely replaced the water column. In principle, this should allow the geological effects to be seen without the bathymetric overprint.
The satellite-derived Bouguer map (Map 3a) does suggest that the primary purpose of the correction has been achieved. Apart from the island of Mayotte itself, where a gravity high marks the site of the intrusive rocks forming the island’s core, the variation in Bouguer gravity values is surprisingly small, and the roughly oval low surrounding the high testifies to the low density of the extrusive and volcaniclastic rocks that make up the flanks of the Mayotte edifice. One thing that also emerges is that there is no good gravity evidence at this level of resolution for the existence of the caldera east of Mayotte postulated in the Eos article.
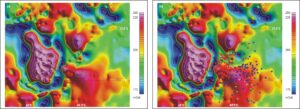
Map 3. a) Bouguer gravity in the vicinity of Mayotte, based on the satellite-derived 1-arc-minute free-air and bathymetric grids. Contour interval 10 mGal b) International Seismological Centre epicentres superimposed on Bouguer gravity. Colour coding indicates periods of activity. Blue circles denote earthquakes between the 13th of May and the 10th of June 2018 , red circles those between the 16th of June and the 7th of July, and other colours the more recent events
The obvious next step has been to search for meaningful correlations between Bouguer gravity and seismicity, and in Map 3b the post-2017 epicentres listed in the catalogue of the International Seismological Centre have been plotted on the Bouguer map. These events, in an area that was previously very seismically quiet, are now generally considered to be due to the movements of the magma that produced the volcanic pile mapped by the Marion Dufresne. The colour coding used to identify the dates of the events shows a clear shift in the locations of the ‘clusters’ belonging to the different periods, but overall there seems to be a quite strong correlation between the broad Bouguer high east of southern Mayotte and the roughly circular area within which the earthquakes occurred. This would certainly be something round which theories might be developed, but a wise geophysicist would first be sure of his or her data. Maps 4a and 4b compare the epicentre locations taken from the ISC catalogue with those listed in an online data supplement to the Lemoine et al paper.
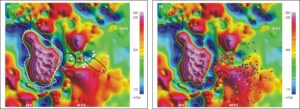
Map 4. a) Bouguer gravity and relocated epicentres of events with magnitudes equal to or greater than 5.0, from Lemoine et al (2020). The black circle and black ellipse marking cluster locations and the red triangle marking the new volcano are taken from one of the illustrations to the Eos article, and the white dashed line from the same source marks the edge of the Mayotte Platform. b) International Seismological Centre epicentres superimposed on Bouguer gravity in the same area. All the relocated epicentres in (a) are for events corresponding to the ‘blue’ events in (b).
It is immediately obvious from a comparison that the relocations, which were listed in the supplement only for events with magnitudes greater than or equal to 5.0, have shifted the epicentres north, to a region where the ISC found very few events for the first period of activity. The new strong correlation is with a gravity low, but there is also a curious inconsistency between the locations plotted using the relocations and the positions of the earthquake clusters indicated by a circle and an ellipse in the Eos article. It is an inconsistency that extends to the much more complete plots appearing in the Lemoine et al. paper.
Clearly, this area is one to watch for many reasons, but the most intriguing question of all is ‘why has the volcanic activity in the Comoros suddenly back-tracked to the middle of the chain’?