EGM2008 and WGM2012
The idea of making global maps of Earth gravity must go back a very long way, but it was really only after artificial satellites began to be tossed into orbit that the dream became any sort of reality. The first heroic attempts to use these objects to measure gravity involved tracking the perturbations in their orbits to estimate very regional variations. A quantum leap forward came when it was realised that measurements of sea surface elevation could be converted into estimates of free-air gravity, with a resolution initially measured in tens of kilometres but which is now down to just a few kilometres. Then came satellites such as GRACE and GOCE deliberately launched with the aim of measuring gravity directly at orbital heights.
The challenge then was to integrate all this satellite-based information with results obtained from measurements made on the Earth’s surface (and, increasingly, with measurements made in the air), and the drivers for this have been the geodesists, with their emphasis on free-air gravity, rather than the geophysicists, who prefer Bouguer gravity. A new Earth Gravity Model (EGM) has been promised for 2020, but at the moment the best we have is EGM2008, presented to the world by the US National Geospatial Agency (NGA) to degree 2160 in terms of the spherical harmonics beloved by geodesists. For those of us who prefer our data as grids, the Bureau Gravimetrique International has done the heavy lifting, and EGM2008 free-air gravity grids with a 2.5 minute cell size can be downloaded from their website.
The BGI has also taken things quite a bit further. EGM2008 was focussed on things such as geoid heights and undulations. Free-air gravity was calculated as a means to those ends, and was made available, and it was the BGI that took the next step and produced global grids of Bouguer gravity. An ‘EGM2008’ Bouguer gravity was calculated in an almost conventional fashion, via terrain corrections out to a distance of 167km, using the 1 arc-minute by 1 arc-minute ETOPO1 Digital Elevation Model and a reduction density of 2.67 Mg/m3.
That must have been a massive effort, but the BGI didn’t stop there. They went back to first principles and calculated total topographically-corrected gravity anomalies using EGM2008, the Danish DTU Global sea-surface model DTU10 and a 1’x1′ arc-minute (~ 2km at the equator) terrain derived from the ETOPO1 model and allowing for the contributions of most surface masses (atmosphere, land, oceans, inland seas, lakes, ice caps and ice shelves) via spherical harmonics/ This they called WGM2012, and one advantage of this approach was presumably that it must have simplified the further reduction to isostatic gravity.
An enormous undertaking, but how successful has it been? That can really only be assessed by looking at least one actual example, ideally a small country with a reasonable coverage of conventional gravity stations and a significant, but not extreme, topography. A country such as Djibouti.
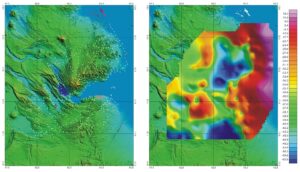
Left: SRTM topography of Djibouti. White circles indicate locations of gravity stations of the Hamburg University 1972 survey. Right: Shaded relief contour map of Bouguer gravity, based on the results of the 1972 survey (Makris et al. 1975)
As a test case, Djibouti has many things to recommend it. The topography is rugged but not extreme, with the highest point in the country a little over 2000 metres a.s.l., and the conventional land gravity data that went into the formulation of EGM2008 is known with some certainty. Just over a hundred of the almost 500 gravity stations were occupied in the 1930s, but the bulk of them (389 stations) were obtained during a 1972 survey by the University of Hamburg, and it is only these that have been used to produce the shaded-relief contour map above. Three suspect stations unsupported by neighbours were removed before contouring, but the general reliability of this data set has been confirmed by more detailed proprietary work completed a few years ago. The coverage can be considered as good at a regional level, with better than one station per 50 sq.km and a reasonably uniform distribution. A contour map of directly-derived Bouguer gravity shows a relatively simple pattern.
To control the EGM2008 spherical harmonic coefficients in the Djibouti area, the land data, with its average station spacing of about 7km, would have been merged with the various forms of satellite data, all with lower resolution. To extract Bouguer gravity, free-air gravity values computed using these coefficients would then have been operated on using the ETOPO1 topographic data, with its roughly 2 km resolution. This would have represented a considerable challenge.
Has it been successful? The illustrations below show, on the right, the Bouguer gravity plotted as a colour-shaded grid and, on the left, contours derived from the grid, superimposed on the topography.
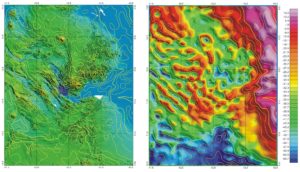
Left: SRTM topography of Djibouti, with superimposed 10 mGal Bouguer gravity contours derived by the Bureau Gravimetrique Internationale from EGM2008. Right: Shaded relief and 10 mGal line contour map of the same data.
Given that the aim of the Bouguer correction is to remove the worst of the topographic effects from the computed gravity value, it has to be said that the aim has not been achieved. It is quite clear that simply taking the EGM2008 model and applying a conventional Bouguer correction based on a topographic grid with roughly the same resolution does not work. Does the much more complicated approach adopted in computing WGM2012 do any better?
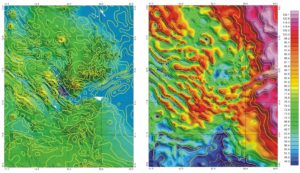 .Left: SRTM topography of Djibouti, with superimposed 10 mGal Bouguer gravity contours from the Bureau Gravimetrique Internationale’s WGM2012 grid. Right: Shaded relief and 10 mGal line contour map of the same data.
Alas, no! There are differences between the two maps, but they are relatively minor. The overwhelming topographic correlation is still there. Moreover, the rough agreement in range of Bouguer values that existed between the actual land data and EGM2008 Bouguer values has disappeared. The massive effort put into the calculation has not improved the situation at all. Why it has not done so will be the subject of next month’s blog.
EGM2020 is almost here, we are assured, and will undoubtedly provide us with a better image of the Earth’s free-air gravity variations. But the fundamental problem with getting a Bouguer gravity image will remain. The lesson is that Bouguer gravity grids in land areas have to be calculated from point Bouguer gravity values. They cannot be reliably calculated by combining free-air grids and topographic grids, however sophisticated the mathematics used to do so.